Public Access services for planning, building control and licensing applications will be unavailable 27 and 28 April due to essential maintenance.
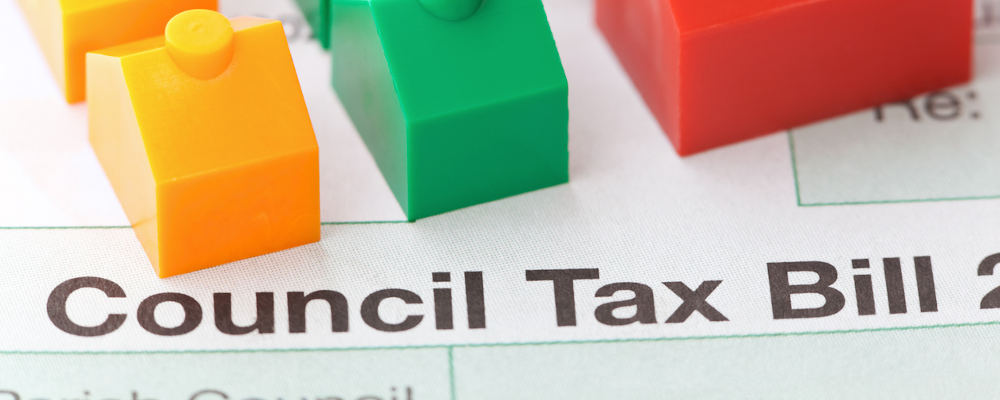
From April 2024 the date for council tax direct debit payments will automatically change.
Council Tax BillRead more
Apply for a grant of up to £3,000 to help your community.
Member-Awarded-Funding-homepage-sliderRead more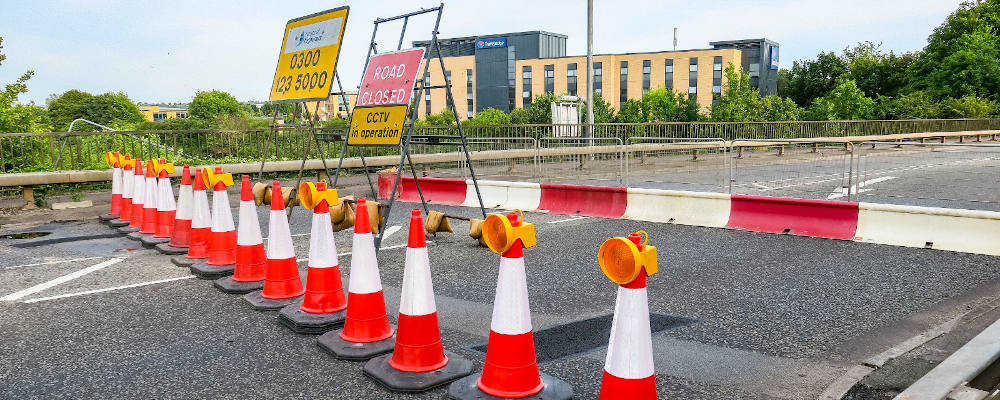
National Highways has closed a section of the A432 for detailed structural investigations of the M4 bridge.
A432-BadmintonRd-M4overbridge-closureRead more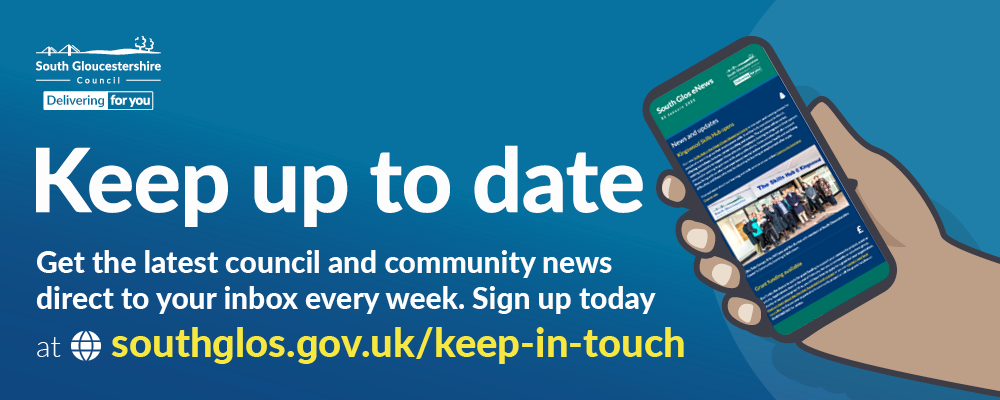
Sign up now to receive the latest council and community news direct to your inbox every week.
Enewsletter sliderRead more


